This blog post is a version of my recent SOTM 2021 presentation on the OpenStreetMap Standard Layer and who’s using it.
With the switch to a commercial CDN, we’ve improved our logging significantly and now have the tools to log and analyze logs. We log information on both the incoming request and our response to it.
We log
- user-agent, the program requesting the map tile;
- referrer, the website containing a map;
- some additional headers;
- country and region;
- network information;
- HTTP protocol and TLS version;
- response type;
- duration;
- size;
- cache hit status;
- datacenter;
- and backend rendering server
We log enough information to see what sites and programs are using the map, and additional debugging information. Our logs can easily be analyzed with a hosted Presto system, which allows querying large amounts of data in logfiles.
I couldn’t do this talk without the ability to easily query this data and dive into the logs. So, let’s take a look at what the logs tell us for two weeks in May.
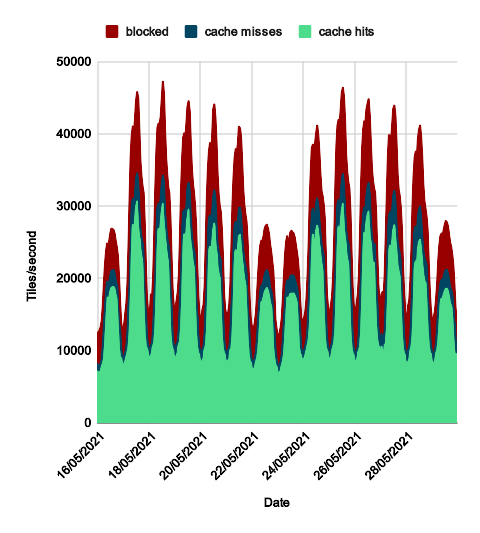
Although the standard layer is used around the world, most of the usage correlates to when people are awake in the US and Europe. It’s tricky to break this down in more detail because we don’t currently log timezones. We’ve added logging information which might make this easier in the future.
Based off of UTC time, which is close to European standard time, weekdays average 30 000 requests per second incoming while weekends average 21 000. The peaks, visible on the graph, show a greater difference. This is because the load on weekends is spread out over more of the day.
On average over the month we serve 27 000 requests per second, and of these, about 7 000 are blocked.
Blocked Requests
Seven thousand requests per second is a lot of blocked requests. We block programs that give bad requests or don’t follow the tile usage policy, mainly
- those which lie about what they are,
- invalid requests,
- misconfigured programs, or
- scrapers trying to download everything
They get served
HTTP 400Bad Request if invalid,HTTP 403 Forbiddenif misconfigured,HTTP 418 I'm a teapotif pretending to be a different client, orHTTP 429 Too Many Requestsif they are automatically blocked for making excessive requests by scraping.
Before blocking we attempt to contact them, but this doesn’t always work if they’re hiding who they are, or they frequently don’t respond.
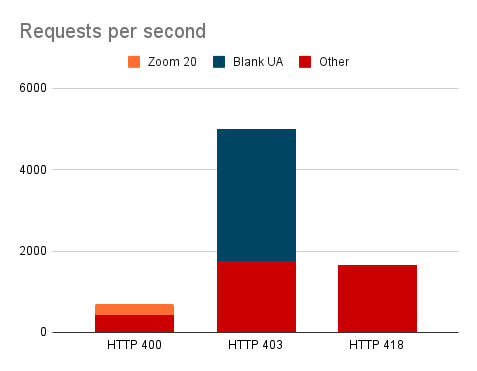
HTTP 400 responses are for tiles that don’t exist and will never exist. A quarter of these are for zoom 20, which we’ve never served.
For the HTTP 403 blocked requests, most are not sending a user-agent, a required piece of information. The others are a mix of blocked apps and generic user-agents which don’t allow us to identify the app.
Fake requests get a HTTP 418 response, and they’re nearly all scrapers pretending to be browsers.
In July we added automatic blocking of IPs that were scraping the standard layer, responding with HTTP 429 IPs that are requesting way too many tiles from the backend. This only catches scrapers, but a tiny 0.001% of users were causing 13% of the load, and 0.1% of QGIS users causing 38% of QGIS load.